The inflation adjusted household income has just hit a record high. Check out how much progress was made since Trump arrived in 2017. Note while high income households had the best results, a rising tide lifts all boats:
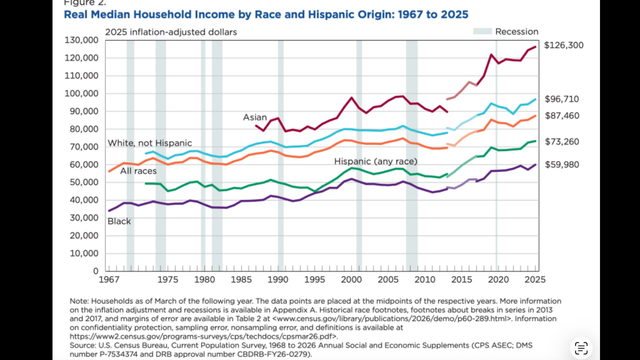

The inflation adjusted household income has just hit a record high. Check out how much progress was made since Trump arrived in 2017. Note while high income households had the best results, a rising tide lifts all boats:
Note also the sad Carter, Obama and Joe Biden years. The only Democratic president who did well was Bill Clinton because at least he lived in the real world. All the Democratic empathy achieves is lower the incomes of the people they are supposedly going to help

Claude Opines:
"Verdict: the headline is accurate, but most of the argument around it doesn't hold up
The chart is genuine. It is Figure 2 from the US Census Bureau's Income in the United States: 2025 report (P60‑289), published on 16 September 2026. The post uses it correctly on one point and wrongly on the other three.
Claim 1: "Inflation‑adjusted income has just hit a record high"
This is true. Real median household income was $87,460 in 2025, up from $85,210 in 2024. That is a rise of 2.6%, which the Census Bureau says is statistically significant, and it is the highest figure since the series began in 1967.
There is a caveat, though. CBS points out that the 2019 figure was $85,320. That means real income grew only about 2.5% over six years. Between 2013 and 2019 it grew about 19%. So this is a record, but it follows years of standing still rather than a sharp jump.
Claim 2: "Look how much progress since Trump arrived in 2017"
This is misleading. The period since 2017 covers Trump's first term (2017–2020), all of Biden's term (2021–2024), and only 2025 of Trump's second term. The chart shows three phases:
2017–2019: strong gains, reaching what was then a record in 2019.
2020–2022: a fall during the pandemic and the inflation that followed.
2023–2025: a recovery, with most of it happening in 2023–24, before this term began.
Measuring from 2017 gives Trump credit for the Biden years as well. It also hides the fact that incomes lost ground and then recovered along the way. The lighter line sections around 2013 and 2017 also mark changes in how the survey was run, so comparing across those years needs some care.
Claim 3: "High income households had the best results"
The chart doesn't show this. It splits households by race and Hispanic origin, not by income level. The top line, at $126,300, is the median for Asian households, not high earners. Separate data in the report does show high earners doing better: the 90th percentile rose 1.7%. But that comes from a different table, not this chart.
Claim 4: "A rising tide lifts all boats"
The data says otherwise. In 2025:
The poorest 10% saw no significant change in income. CBS describes it as a slight fall.
Asian and Hispanic households saw no significant change.
Inequality (measured by the Gini index) did not narrow.
The richest fifth of households took 52.4% of all income, and the poorest fifth took about 3%.
The Supplemental Poverty Measure, which counts costs such as healthcare, was about 13.1%. That is roughly three points above the official rate of 10.2%.
A fair one‑line correction
"Real median household income reached a record $87,460 in 2025, up 2.6%. But it is only about 2.5% above 2019, much of the recovery came before 2025, and the lowest earners saw no significant gain."
Sources:
Census Bureau: Income, Poverty and Health Insurance Coverage in the United States: 2025
Census Bureau: Income in the United States: 2025 (P60‑289)
Census Bureau: Median Household Income in 2025 Surpassed Previous Highs
Axios: Household income hits record, but lower earners lose ground
CBS News: Americans' incomes hit a record high in 2025. Now for the bad news.

Ja, read between the headlines ... asb.
Yes the point about race groups is fair, but it applies to Blacks who are on average a lower income group. So here are the results. Trump’s first term was better than any other President, some being 8 years and some 4. Obama’s recovery 4 years was actually higher but only because it was preceded by 4 heavily negative years. And Trump’s last year was heavily suppressed by the COVID contraction. He was trending for a greater than 10% number before COVID.
Taking the simple arithmetic average of each president’s completed four-year term results:
President First term Second term Average per four-year term
Clinton +5.3% +8.2% +6.75%
Reagan +0.4% +7.8% +4.10%
Obama −4.4% +11.8% +3.70%
Biden +1.9% — +1.90%
Carter +1.0% — +1.00%
George W. Bush −2.5% +0.8% −0.85%
George H. W. Bush −3.3% — −3.30%
Trump +8.2% incomplete +8.20% completed-term average
There are only three Presidents who succeeded in raising incomes above the trend….Trump, Clinton and Reagan.
Big Tech is carrying both Trump and Biden.

@sharkbok ... it's only as impartial as the data Claude used to evaluate it... algorithms are still written by humans, as is the soarce data...
Copy and paste this whole thread and ask Claude to fact-check
Verdict: the numbers in the table are right, but the conclusions drawn from them are not
I checked his figures against the Census Bureau's real median household income series (FRED series MEHOINUSA672N, in 2025 dollars). Each term is measured from the year before it starts to its final year. Every figure from Reagan's second term onward matches his table:
Term Start → end Change
Reagan 2 (1984–88) $61,910 → $66,740 +7.8%
G.H.W. Bush (1988–92) $66,740 → $64,560 −3.3%
Clinton 1 / 2 $64,560 → $67,980 → $73,560 +5.3% / +8.2%
G.W. Bush 1 / 2 $73,560 → $71,700 → $72,260 −2.5% / +0.8%
Obama 1 / 2 $72,260 → $69,070 → $77,230 −4.4% / +11.8%
Trump 1 (2016–20) $77,230 → $83,590 +8.2%
Biden (2020–24) $83,590 → $85,210 +1.9%
Trump 2025 $85,210 → $87,460 +2.6%
His later figures also check out. About 84% of the gain since 2016 falls in Trump years. The 2025 rise ($2,250) is bigger than the whole of Biden's term ($1,620). His annual averages of roughly 2.2% and 0.5% are about right. I couldn't check the Carter and Reagan first-term figures, because this series starts in 1984. The problems are in how he reads the numbers.
"Trump's first term was better than any other president"
This is false by his own table. Obama's second term (+11.8%) beat Trump's first (+8.2%). He waves this away because Obama started from a low point. But he then adjusts Trump's figure upward for COVID. Starting points are either fair to adjust for or they aren't; he can't adjust for Trump only.
His COVID point has some basis. From 2016 to 2019, income rose 10.5%. However:
2019 alone was +7.2%, and that is a disputed year. The survey was carried out in March 2020, just as the pandemic hit, and response rates fell sharply. Census Bureau researchers later estimated that this pushed the 2019 median up by about 2.8%. So "over 10% before COVID" relies partly on a known measurement problem.
Growth was already strong before 2017. Income rose 5.4% in 2015 and 3.5% in 2016. The 2017–18 gains (+1.8% and +1.3%) were actually slower than that.
"Only Trump, Clinton and Reagan raised incomes above trend"
This is false once "trend" is defined. He never says what the trend is. Over 1984–2024 the long-run rate works out at about 0.8% a year, or roughly 3.2% per four-year term. Obama's average (3.7%) is above that. Even measured over his full eight years (+6.9%, or about 3.4% per term), he is still above trend. So at least four presidents clear the bar, not three.
"Trump's second term is trending at 10.4%"
This isn't a valid method. Multiplying one year by four is not a forecast. By the same logic, Biden's 2023 (+4.0%) would have been "trending" at 16%. Annual changes jump around a lot, and each year's figure also has a margin of error of roughly ±1%.
"Trump was associated with 80% of the growth"
The arithmetic is right, but it depends on the starting year. The figure changes a lot depending on which year you start from and which years you credit to each president. Policies take time to affect incomes, so a president's first year mostly reflects the previous administration. Biden's term also covered the 2021–22 inflation spike (real income fell 2.2% in 2022), and he started from a 2020 figure affected by the same survey problems. Choosing where to start and end largely decides the result.
"The race point applies to Black households"
The figure is correct, but it doesn't back up his argument. Black household income did rise 4.8% in 2025, which is statistically significant. But race is not the same as income level. The direct measure of low earners, the 10th percentile, showed no significant change. Asian and Hispanic households saw no significant change either. So the "rising tide lifts all boats" claim is still not supported by the 2025 data.
A fair summary to post back
"Your term figures are arithmetically correct. But Obama's second term beat Trump's first (+11.8% vs +8.2%). 'Trend' isn't defined, and on a 40-year trend Obama is also above it. Nearly half of Trump's first-term gain came in 2019, a year the Census Bureau says was overstated by survey problems. And one year multiplied by four isn't a trend."
On the "well prompted" jab: the first fact check used only the Census Bureau's own figures. The same data is behind every number here, including the ones that support his table. He himself notes that luck and the economic cycle play a big part in these comparisons.
Sources:
FRED: Real Median Household Income in the United States (MEHOINUSA672N)
Census Bureau: Income, Poverty and Health Insurance Coverage in the United States: 2025
Census Bureau: Income in the United States: 2025 (P60‑289)
CBS News: Americans' incomes hit a record high in 2025
Nope I never adjusted Trump’s number for the comparison with other Presidents’ numbers, I adjusted it up as an illustration of what his number may have been if Covid hadn’t happened.
Trend could be defined as a forty year trend. But it could also be defined since Clinton took office….a more applicable modern trend. Your AI assistant is taking everything literally to support the points you obviously wish to be made. But let’s leave it that Obama was fourth even starting from the benefit of a declining Bush second term. That pesky starting year again.
As for Obama’s 11.8% growth rate after a 4.4% decline….how could that possibly be more impressive than 8.2% after 11.8%. Oops that never occurred to Claude, odd because he downgrades Trump because of the ‘starting year’. And if one year multiplied by 4 isn’t a trend and therefore makes Claude unhappy if projected, perhaps he’d tell us with the data we have available in this debate, how he would would predict the next three years. What would his estimate be.
In any case it’s nice he verified the key numbers and I don’t mind the quibbles as long as I can quibble back.
Pretty much I see this whole thing as verification of my original positions. But I’ll say this Shark I’d prefer it if you debated and used AI to back up your own thinking rather than letting AI do all your thinking for you. It’s going to be pretty boring if debates descend into AI fact checking as the reflex response and every debate being decided by which AI model is most open to manipulation.
But what happened to tariffs destroying growth. What happened to the impending stock market decline….pretty much the same thing that will happen to the Iran will win the war predictions by the same people. Reality has a way of catching up with the fantasies of emotional thinkers.
There is a pesky data point that Trump is polling lower on the economy than any US president. Even Fox News polling confirms this.
On the "well prompted" jab: the first fact check used only the Census Bureau's own figures.
Ooohh Claude firing shots!

And guess who uses loaded and biased prompts to manipulate AI into giving the answers he wants?
LMAO!